
Passing the sniff test: the science behind our decision tool
Workshop participants might ask how such simple data gathered from a small crowd of people in a community can achieve accurate results. We’re conditioned to thinking that the only way to achieve scientific accuracy is to collect a vast numbers of samples. If you recall anything about school maths you might remember that increasing sample size increases the precision of an average estimate. This is indeed true. However, depending on the problem you’re trying to address, it isn’t always necessary. There is another approach that is often more accurate and more achievable. In this post we want to introduce you to some of the science behind our decision tool for Port Phillip Bay. This is quite a long post but it introduces you to some of the scientific thinking that is the secret sauce of this modern approach to community conservation planning.
It’s not just about sample size
It’s not the quantity of data we collect that matters as much as the context in which we collect it. For example, each time you communicate with anyone on a phone or video call, you are only receiving a digital interpretation of their voice / face. Ever since telecommunications were invented mathematicians have been subjecting you to a form of ‘model’ – that being something they’ve built to look or sound like the real thing. They use a concept known as Information Entropy to minimise the amount of information you need to make sense of a message.
Similarly, some of the world’s biggest economic decisions, including the launch of major companies or political manifestos, are based on data from focus groups. Focus groups are small numbers of people, often 6-12 individuals, who represent the way society feels.
Context matters most of all
If you put data in the right place, you can inform pretty accurate results by building a recognisable picture from the results. For instance, if you’re a company that makes strawberry jam, you might ask a small number of taste-testers to choose the best recipe before spending a million dollars on production. You sample wisely. You use a variety of people with different tastes and you arrange your jams according to specific flavours: sweetness, tartness etc.

A small number of participants test the flavour of a brand before going to market.
Even though the number of participants is small, the result is accurate enough to risk an entire business, and the livelihoods of all its employees. Building in more data won’t alter the overall trend. It could increase precision but the average will remain roughly the same, give or take a bit of variation. For many critical decisions in life, we don’t need that much precision.
Emergent Properties
When we ask the right questions and we arrange the answers according to what we want to know, we can get an accurate result with small samples. For example, even though the resolution of a human eye is 576,000,000 pixels, if you’ve seen someone before, you can recognise their face from the billions of people on Earth from as few as 20 pixels.

Figure 1: The top line are images of the late Queen and David Attenborough. The chances are you can easily recognise one or both of these individuals even though their faces comprise only about 100 pixels. The same images are represented below as pixels, when the data is distributed randomly. In short, if we know where the data needs to be put to build a face, it’s not the number of pixels so much, as where we put them that matters. If we add more pixels to the top image, it won’t alter your answer to the question: who is this person?
Your ability to recognise someone is based on the emergent properties of their face. These are the parts of the ‘model’ or picture, that we use to recognise a pattern and make an informed decision. When an image is pixelated, you can often still tell who it is, simply by the emergent properties of their face: their eyes, nose, mouth and ears are all in the right place for that person.
Housing information in the right place
Therefore, to ensure the knowledge we gather as a community is relevant, we have to build a system to house community knowledge in the right place – to build a picture that makes sense to all of us, like a face makes sense.
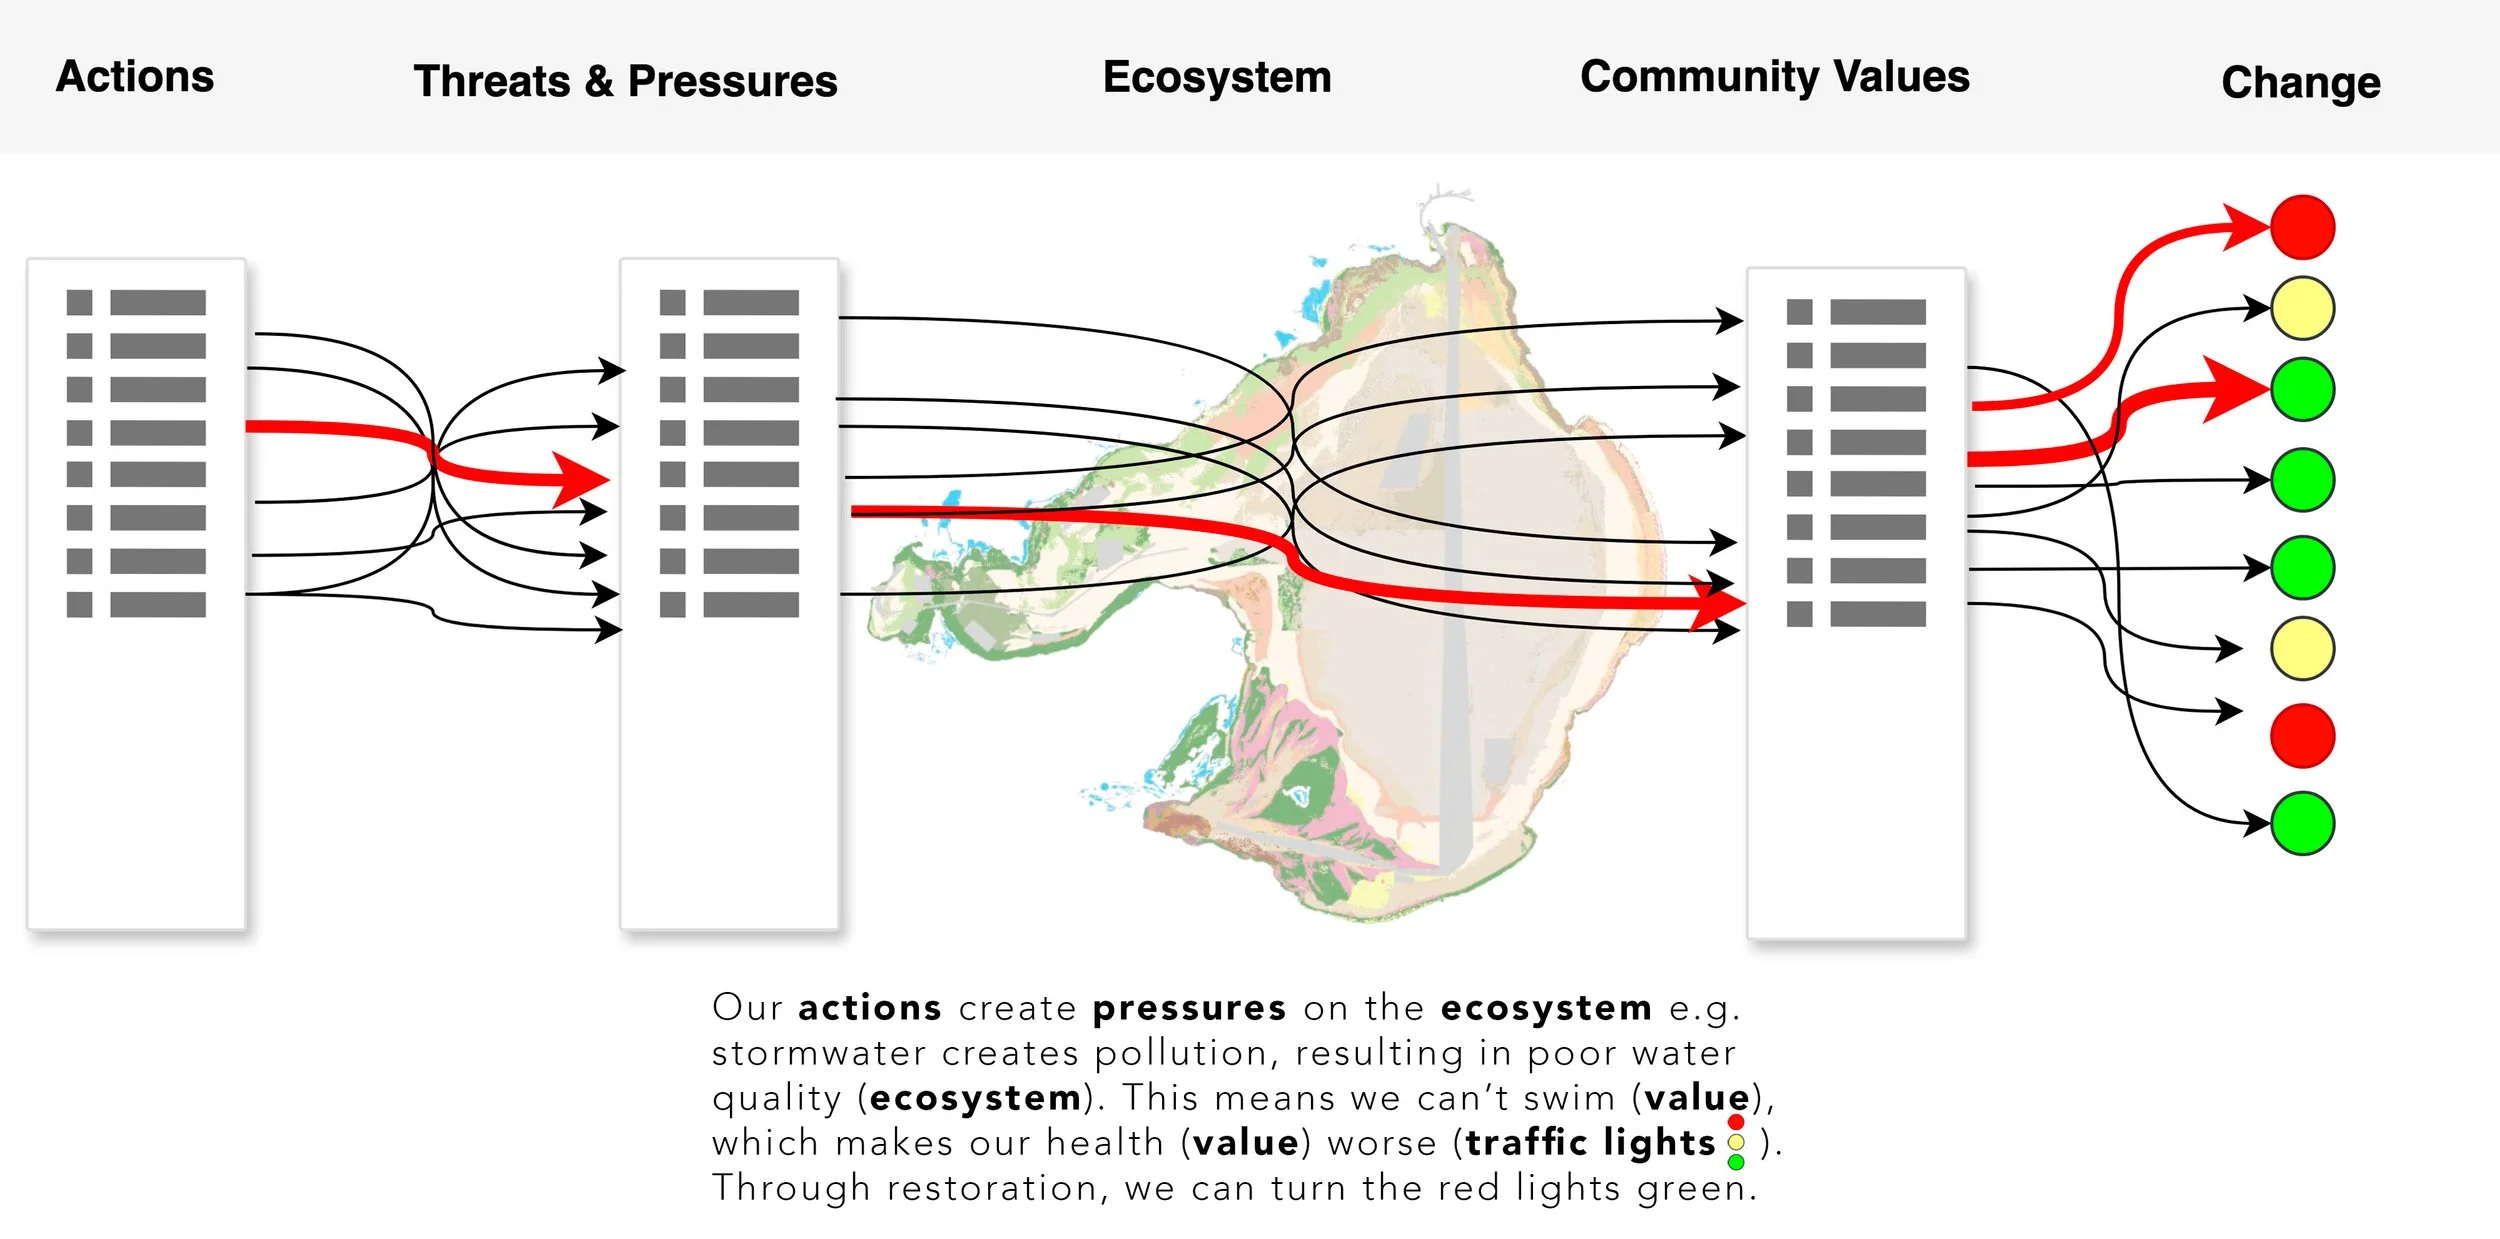
This is a simplified picture of our decision tool can work.
Say we want to know how our values relate to pressures and threats on the ecosystem. As yet we don’t know exactly what the specific questions are (your community will begin to ask those, as we become aware of what things look like) but we are more than aware of how to arrange the information to reveal those questions and help create answers.
We could try to fill the model with ridiculous amounts of data and investigate every one of the millions of connections individually. But that would be impossibly time-consuming and unnecessary. Instead, we can get accurate enough data for decisions by identifying the key emergent properties. To be representative, we simply have to make sure we have collected a minimum amount of information for each of the connections between ecosystem features, ecosystem services and community values. If we miss any important ones, it would be like omitting the nose data from David Attenborough!
Collecting a representative sample of connections is what we are doing with our initial workshops.
Further ensuring representativeness
To further ensure the data we share with each other is scientifically viable, we also have to make sure our ‘testers’ are people with a wide enough variety of ‘tastes’. For example, there is no point only asking people who can taste salt, to flavour test a sweet jam.
Our focus groups need to be broadly representative, which is the part of the method we established here: https://www.restorethebay.org.au/news/how-do-you-personally-connect-to-the-bay.
Community outreach is commonly done wrongly, by approaching specific groups e.g. snorkelers, fishers or conservationists. This risks only asking people with specific tastes. What we need is representation from our community – people who have a range of average values.
Once we have that ‘focus group’ for each connection in the model, we can be confident that our decision tool will accurately reveal patterns in the emergent properties. Then can use this to do some cool analysis together. For example, as a community, we might be able to identify the top-10 most important actions we can take, to preserve 90% of our community’s economic value.
In this case, the emergent properties aren’t eyes, nose and ears, they are the components that connect us to our environment, like ecosystem features and values.
Common (chaotic) versus a complex systems approach
The common approach to planning (A, below) is chaotic and results in more problems than it solves. We collect lots of information about people’s problems (which we all want to talk about all of the time) and try to fit actions to those, to address threats. However, the data we gather isn’t placed in any kind of understandable framework that allows us to see the emergent properties. Which means the expenditure and outcomes are equally chaotic, often wasteful and fail.

In our approach (B), we place community data where it fits into the picture of how our values connect to the other emergent properties of our society: threats, actions, ecosystem features etc.
As we are discovering, the majority of our socio-economic values arise from the health of specific ecosystem features and services. In our approach (B) we know exactly where this lies. In essence, the methodology we commonly expect to use (and we expect our responsible authorities to use) for decision-making (A) might not pass the sniff test. It is often incompatible with the outcomes we want.
Benefits of this alternative approach
Hopefully this helps explain why this alternative approach is so valuable. The science behind the methods is rigorous and well-researched and has these benefits.
It is achievable and accurate with only focus group sized input initially.
It is more representative than the common approach, meaning its instantly more accurate.
It puts information in a framework that we will be better able to understand for decision-making (putting our community at a great advantage).
It’s achievable in a short space of time and at a much lower cost than common methods, meaning it’s accessible for our communities to enable their own outcomes.
It helps us all identify where actions will have the greatest impact on everyone’s values, which means we can be more confident in our decisions.
Precision and confidence
As we progress through this process, however, we may need to build in more information to establish greater precision and confidence in the results. While it’s unlikely to change the overall trends, fine-scale planning can involve more in-depth assessment of individual parts of the picture. Once again, that will happen because our community wants it or needs it.
For example, speaking metaphorically, what if we know it’s David Attenborough but a decision to take a specific action depended on knowing more precisely how wide David Attenborough’s nose was (LOL). In which case, we would need more pixels to apply to his nose!
Seriously though, if we identify that 25% of community values are affected by impacts on three specific ecosystem features, we might want to interrogate that more specifically, to identify exactly where those features are and which community members are most seriously affected.
Increasing confidence and precision in the decision tool will happen as we progress further along the line of this important community project.
That notwithstanding, what we are doing now, will be inherently more accurate and lead to better decisions than we’ve been able to make in the past.